The honest answer to “what’s a good PPC conversion rate?” isn’t a single percentage. It’s a question of context. Your industry, your offer, your audience, and the platform you advertise on all bend the benchmark in different directions.
The cross-industry average for Google Ads conversion rate was 7.52% in 2025, according to WordStream and LocaliQ’s annual search advertising benchmarks. That data is US-based, but it’s the largest and most current PPC dataset publicly available. Australia and the US sit in the same pricing tier on Google Ads, so the patterns are directionally useful for Aussie advertisers.
The spread across industries in the WordStream data ran from 2.55% in Finance and Insurance to 14.67% in Automotive Repair, Services and Parts. A six-fold gap on the same platform, which is exactly why one headline figure isn’t the answer.
What Is a PPC Conversion Rate?
PPC conversion rate is the percentage of ad clicks that result in the action you want. That action might be a purchase, a lead form submission, a phone call, or a download. It works as a simple ratio. Take your conversions, divide by your clicks, and multiply by 100.
If 200 people click your ad and 10 of them buy or enquire, your conversion rate is 5%.
The metric is straightforward. The way it’s used is often where things go sideways. Conversion rate is a measure of campaign quality, but only when you read it against the right benchmark, the right traffic volume, and the right business outcome. A 3% conversion rate at $40 a lead is healthier than a 12% conversion rate at $400 a lead. Rate without cost is half a sentence.
What Counts as a Good PPC Conversion Rate in 2026?
Most posts on this topic stop at the headline average and call it a day. That’s where the analysis usually goes wrong. The average hides enormous variation, and the variation is where the useful information lives.
Looking at the WordStream data more closely, the industries with the best conversion rates were Automotive Repair, Services and Parts at 14.67%, Animals and Pets at 13.07%, and Physicians and Surgeons at 11.62%. At the other end of the table, Finance and Insurance averaged 2.55%, Furniture 2.73%, and Real Estate 3.28%.
There’s a reason for the gap. Industries that convert well tend to share three traits. The need is urgent, the decision is fast, and the search intent is specific. Someone searching for a tow truck on the side of the highway is not weighing options. On the other hand, someone who is furniture shopping has been comparing for weeks.
So when you’re benchmarking, the question isn’t “am I above 7.52%?” The question is “what does good look like in my industry, on my platform, for my type of conversion?”
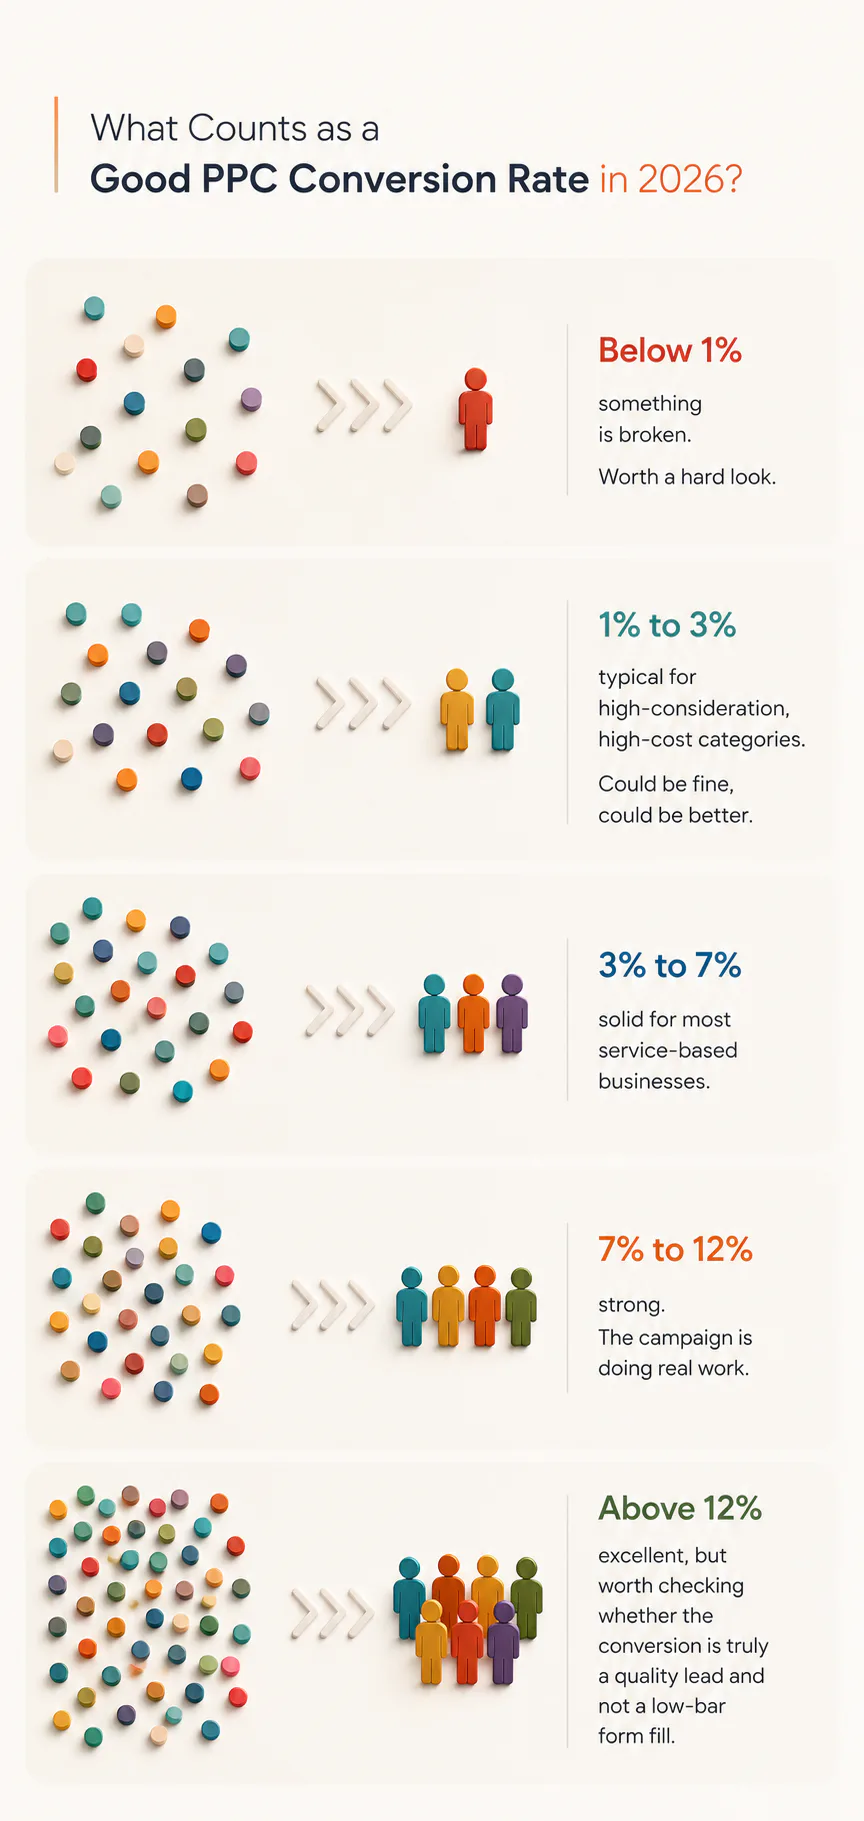
In our experience working on paid campaigns, here’s a rough way to read your own numbers:
- Below 1%, something is broken. Worth a hard look.
- 1% to 3%, typical for high-consideration, high-cost categories. Could be fine, could be better.
- 3% to 7%, solid for most service-based businesses.
- 7% to 12%, strong. The campaign is doing real work.
- Above 12%, excellent, but worth checking whether the conversion is truly a quality lead and not a low-bar form fill.
That last point matters more than people give it credit for. A high conversion rate on weak leads is just an efficient way to waste sales team time. This is one of the reasons our paid advertising team tracks lead quality alongside rate, not in isolation.
Why Does Conversion Rate Actually Matter?
Conversion rate is the bridge between traffic and outcomes. You can drive thousands of clicks, but if none of them turns into customers, you’ve bought attention you can’t bank.
The metric tells you four useful things at once. Whether your ad copy matches search intent. Is your landing page doing its job after the click? Does your offer hold up against the competition? And are you targeting the right people in the first place?
When the rate drops, one of those four is failing. Diagnosing which is the actual work of PPC management.
Conversion rate also drives every cost metric that follows. A higher rate lowers your cost per lead and your cost per acquisition without spending another dollar on clicks. That’s why platforms with automated bidding lean so heavily on it.
Why Conversion Rate Benchmarks Vary by Platform
Conversion rate is shaped by what the user was doing when they saw your ad. That’s why the same business can see wildly different rates across platforms.
Google Search. Highest intent. People are typing in what they want. Conversion rates tend to be the strongest of any paid channel.
Microsoft Advertising. Similar in shape to Google. However, lower competition in many niches, slightly cheaper clicks, and an audience that skews older and higher-income in some regions. Often produces solid conversion rates with less spend.
Meta (Facebook and Instagram). Lower intent. Users are scrolling, not searching. Conversion rates run lower, but reach is broader, and the cost per click is usually lower, too. Strong for visual products and audience-building.
LinkedIn. Built for B2B. Conversion rates on lead forms can be high because the targeting is so specific, but the cost per click is also high. Quality of lead is usually the right metric, not rate.
Display and YouTube. Generally, the lowest conversion rates because the user wasn’t looking for you. These channels work better for awareness, retargeting and assisted conversions than direct response.
The implication is simple. Don’t compare a Search campaign to a Meta campaign on conversion rate alone. They’re doing different jobs.
What Affects Your PPC Conversion Rate?
Five factors do most of the heavy lifting.
Ad Relevance
Your ad has to match what the searcher actually typed. A search for “affordable wedding photographer Brisbane” deserves an ad that says exactly that, not “Professional Photography Services”. Specificity converts. Generic copy loses to specific copy almost every time.
Match your headline to the search intent. Use the language your audience uses, not the language your industry uses internally.
Landing Page Quality
The click is just the price of admission. The landing page does the actual selling.
A page that converts well does five things at once. It loads in under three seconds. The message from the ad carries through without a switch. There’s one clear call to action above the fold. The whole thing works on mobile, which is more than half your traffic. And it includes trust signals such as reviews, recognisable client logos, a real phone number, and a clear privacy policy.
Sending paid traffic to a homepage is one of the most common ways to waste a PPC budget. Build a page for the campaign. Our guide on why design matters covers this in more depth.
Offer Strength
Even a perfect ad sent to a perfect landing page won’t save a weak offer. If your competitor is offering a free quote in 24 hours and you’re asking the user to fill in a 12-field form for the privilege of being contacted, the competitor wins.
Look at what your offer asks the user to do, and look at what they get in return. The exchange has to feel fair. The more friction in the ask, the higher the value of the reward has to be.
Audience Targeting
The most common cause of a low conversion rate isn’t bad creative. It’s the right ad shown to the wrong person.
Tighten your geography. If you only service the Gold Coast, don’t run national. Use exact and phrase match keywords for high-intent terms. Use negative keywords aggressively. Block “free”, “cheap”, “jobs”, and any product name you don’t actually sell. Layer audience signals where the platform allows it.
Device and Time
People behave differently across devices and times of day. Mobile is now the majority of Google Ads clicks, but it converts at a meaningfully lower rate than desktop. A BMG360 analysis of 15 ecommerce and lead gen brands found that desktop paid search converted 1.9 times higher than mobile on average. That’s not a reason to turn off the mobile. It’s a reason to design a mobile landing page that actually works on a phone, and to consider lower bids on mobile if your numbers don’t stack up.
Time of day matters too. If you’re a B2B service, ads running at 2 am are paying for clicks from people who won’t enquire. Schedule them out.
How Do You Improve Your PPC Conversion Rate?
In our experience, and from what’s broadly shared across the industry, the biggest gains usually come from four moves.
Add Negative Keywords Every Week
Negative keywords stop your ad from showing on searches that will never convert. Pull the search terms report every week and add anything irrelevant to your negative list. Over a few months, this alone can lift conversion rate by 20% or more, just by cutting the searches that were never going to buy.
Run Remarketing
Most people don’t convert on the first visit. Remarketing lets you show ads to people who’ve already shown interest. Visited a key page, started a form, and added to cart. Conversion rates on remarketing audiences run two to three times higher than cold traffic because the audience already knows who you are.
A/B Test One Thing at a Time
The temptation is to change three things at once and look at the result. Don’t. You won’t know which change drove the lift.
Test the headline first. When that’s settled, test the call to action. Then the hero image. Then the form length. Run each test for at least a full sales cycle, usually a week or two minimum, and make sure you have enough conversions to be statistically meaningful. Three leads on a Tuesday afternoon is not a test result.
Improve Your Quality Score
In Google Ads, Quality Score is a 1 to 10 rating of how well your keywords, ads and landing pages fit together. It’s based on three things. Expected click-through rate, ad relevance, and landing page experience.
A higher Quality Score means lower cost per click and better ad position. The same ad spend goes further. Check it in your keyword view under the Columns menu. Anything below 5 is worth investigating, anything below 3 needs work.
How Does CTR Differ from Conversion Rate?
These two metrics measure different stages of the same funnel, and they’re often confused.
Click-through rate (CTR) is the percentage of people who saw your ad and clicked it. CTR tells you whether your ad copy is doing its job. According to WordStream and LocaliQ’s 2025 data, the average CTR for search advertising was 6.66%.
Conversion rate is the percentage of those clicks that resulted in a conversion. It tells you whether what came after the click did its job. The landing page, the offer, the form.
A high CTR and a low conversion rate usually mean your ad is writing cheques your landing page can’t cash. A low CTR with a decent conversion rate often means your ad isn’t reaching the right people, but the ones who get there are quality. Both metrics matter, and they diagnose different problems.
Where to Take This Next
Conversion rate is a diagnostic tool, not a scoreboard. The number tells you something is working or something isn’t. Your job is to figure out which lever to pull next. Could be the ad, the landing page, the offer, the audience, the schedule. Most accounts have three or four of those misaligned at any time, and fixing them in order is more useful than chasing a higher percentage as a goal in itself.
If your campaigns are running and the numbers don’t look right, the answer is usually in one of three places. The search terms report, the landing page analytics, or the offer itself. Start there.
If you’d rather hand it to someone who does this every day, that’s what we do. We set up paid campaigns, manage them, and tune them against your actual business goals, not vanity benchmarks. For more on how we approach this, our digital marketing services page lays out the full picture.