Knowing how to evaluate PPC campaigns is what separates simply running ads from actually seeing a return. Without it, you might rack up clicks but no sales, watch costs rise, and end up staring at a dashboard full of numbers that don’t tell the whole story.
Looking at the benchmarks and focusing on the key metrics can help you evaluate and optimise how your PPC advertising campaigns perform.
What Is PPC Advertising?
PPC (pay-per-click) is a paid advertising model where you pay each time someone clicks your ad. It works by bidding on keywords, audiences or placements across platforms like Google Ads, Microsoft Ads, Meta (Facebook and Instagram), LinkedIn and TikTok. The ad shows, someone clicks, you pay.
The appeal is control. You set the budget, the targeting and the destination. The catch is that none of that matters if you’re not reading the data properly.
What Is PPC Analysis and Why Does It Matter?
PPC analysis is the process of reviewing paid advertising performance to understand what’s working and what isn’t. It works by pulling data from your ad platforms, comparing it against benchmarks and your own goals, and identifying where to adjust.
Without analysis, you can run ads for months and have no idea why some convert and others don’t. With it, you can spot waste before it adds up, find the keywords and audiences that actually drive value, and align spend with the outcomes the business cares about.
Three things change when analysis becomes a habit. You stop guessing. You stop reacting to vanity numbers. And you start making decisions based on the metrics that connect to revenue.
Why Benchmarks Make the Numbers Mean Something
A 3% click-through rate sounds fine on its own. Whether it’s actually fine depends entirely on your industry, your platform and what your competitors are doing.
According to WordStream’s 2025 Google Ads Benchmarks report, the average CTR across all industries on Google and Microsoft Ads sat at 6.66%, with average CPC at $5.26 and average conversion rate at 7.52%. But those overall numbers hide enormous variation. Arts and Entertainment saw an average CTR of 13.10%, while Dentists and Dental Services sat at 5.44%. Attorneys and Legal Services paid an average CPC of $8.58. Arts and Entertainment paid $1.60.
Benchmarks turn raw numbers into something you can act on. A higher-than-average CPC tells you to look at your bidding strategy or keyword choices. A lower-than-average conversion rate tells you to look at your landing page and offer.
Where to find them:
- Industry reports (WordStream, Search Engine Land, Store Growers)
- Platform-specific data inside Google Ads, Microsoft Ads and Meta Ads Manager
- Your own historical data, which is often the most relevant benchmark you have
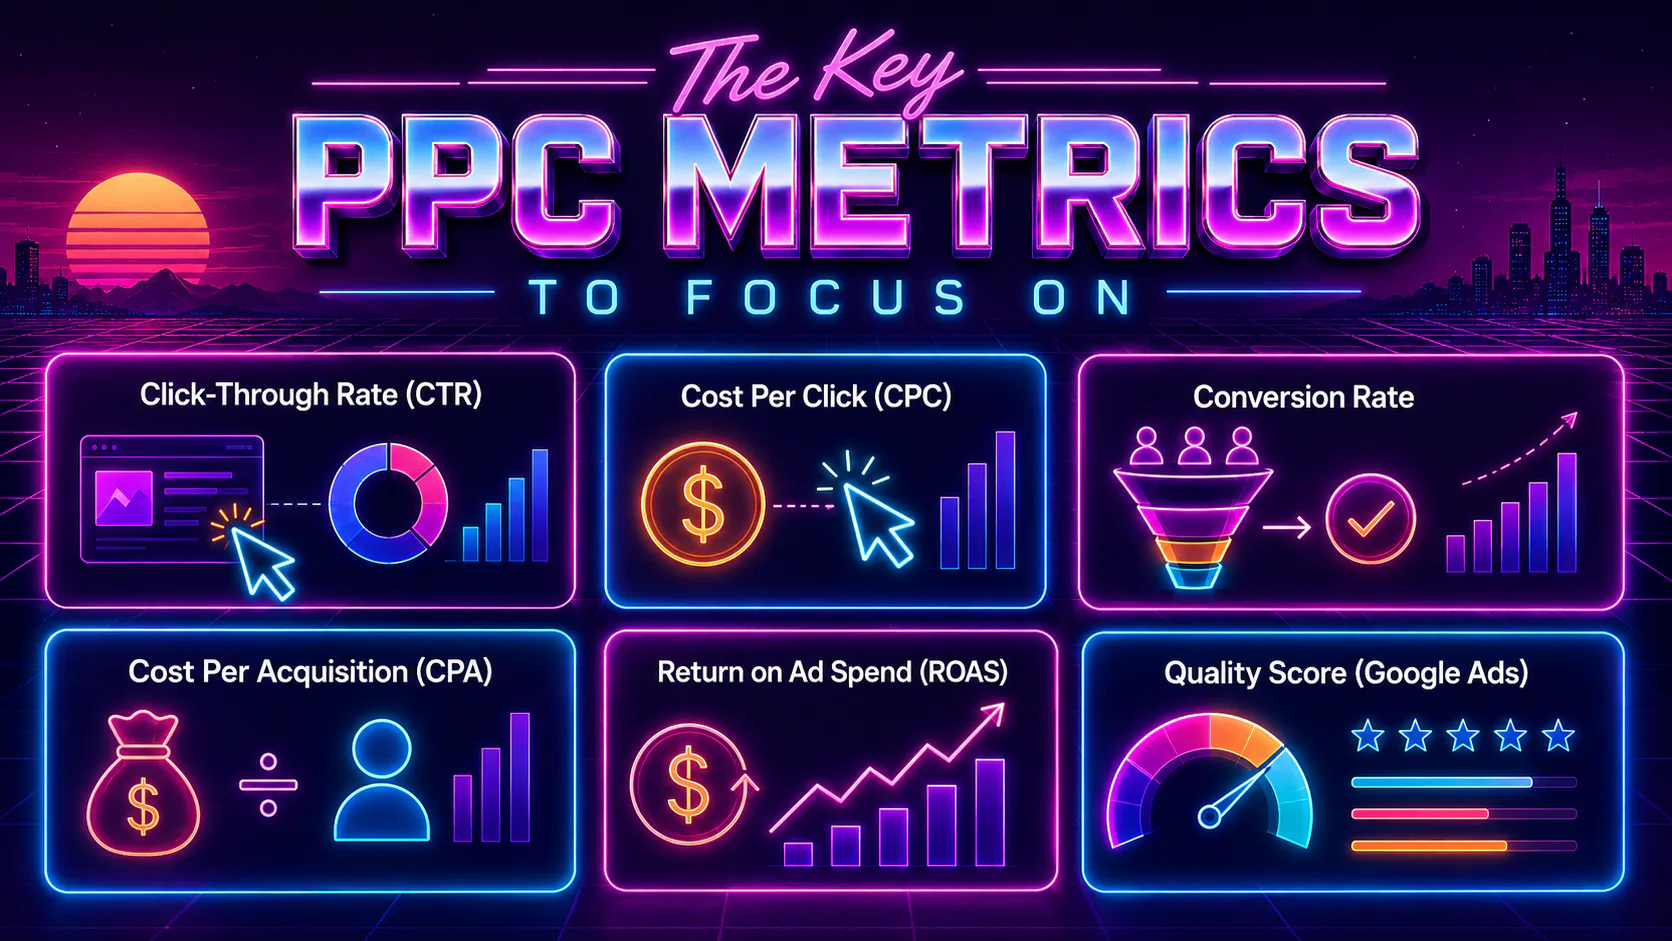
The Key PPC Metrics to Focus On
Before getting into the optimisation work, you need to know what each metric tells you, and what each one doesn’t.
Click-Through Rate (CTR)
CTR is the percentage of people who saw your ad and clicked it. It works by dividing clicks by impressions, then multiplying by 100.
CTR tells you whether your ad is grabbing attention. A low CTR usually means your ad isn’t relevant to the audience, or the creative isn’t strong enough to stand out. A high CTR is a good sign for engagement, but it says nothing about whether those clicks turn into customers.
Cost Per Click (CPC)
CPC is the average amount you pay each time someone clicks your ad. It works by dividing total ad spend by total clicks.
CPC affects how far your budget stretches. High CPCs eat into profit fast if the clicks don’t convert. They’re also often a signal that you’re bidding on competitive keywords without enough relevance to justify the cost.
Conversion Rate
Conversion rate is the percentage of clicks that result in a desired action, like a purchase, form submission or sign-up. It works by dividing conversions by clicks, then multiplying by 100.
This is the metric that connects your ads to the outcome you actually want. A low conversion rate means people are interested enough to click but not enough to act, which almost always points to a landing page or offer problem.
Cost Per Acquisition (CPA)
CPA is how much you spend to acquire one customer or lead. It works by dividing total ad spend by the number of conversions.
CPA is where ad spend meets business reality. If your average customer is worth $200 and your CPA is $250, the campaign is losing money regardless of how good the other metrics look.
Return on Ad Spend (ROAS)
ROAS is the revenue generated for every dollar spent on ads. It works by dividing revenue from ads by cost of ads.
A ROAS of 3 means you earned $3 for every $1 spent. What counts as a good ROAS depends on margin. A 4x ROAS is great for a high-margin service business and not enough for a low-margin retailer.
Quality Score (Google Ads)
Quality Score is Google’s rating of your ad on a scale of 1 to 10, based on expected CTR, ad relevance and landing page experience. It works by scoring each of those three components individually, then combining them.
A higher Quality Score lowers your CPC and improves your ad position. According to Focus Digital’s 2025 CTR research, high Quality Score ads (8 to 10) achieve 92% higher CTRs at Position 1 compared to low Quality Score ads (1 to 3). Relevance pays off in cold, hard cents-per-click.
How to Read the Numbers Together
No single metric tells you the full story. The insight comes from how the numbers connect. Here are the four patterns that show up most often.
High CTR, Low Conversion Rate
The ad is doing its job. The page isn’t.
This usually means there’s a gap between what your ad promises and what your landing page delivers. An ad offering a free consultation landing on a generic contact page is the classic example. Other common causes are slow page loads, a weak or unclear call to action, or missing trust signals.
What to do:
- Audit the alignment. The headline, offer and tone of your landing page should match the ad word for word where possible.
- Improve page speed and mobile experience. Use Google PageSpeed Insights to find the technical issues.
- Simplify the page. Cut form fields, remove distractions, make the next step obvious.
- Add trust elements. Testimonials, reviews, certifications and guarantees all reduce hesitation at the point of action.
Low CTR, High Conversion Rate
You’re reaching the right people. Just not enough of them.
When this pattern shows up, the targeting is usually quite narrow, the ad copy is filtering hard for intent, and the landing page is doing its job for the people who get there. The campaign is efficient. It’s just not scaling.
What to do:
- Broaden targeting carefully. Test new keywords, adjust location settings, and expand audience segments.
- Refresh the ad. New headlines, visuals or formats that hold relevance but appeal to a wider group.
- Improve visibility. Higher bids or better placements can lift impression share without changing what works.
High CPC, Low ROAS
You’re paying premium prices for clicks that don’t earn their keep.
The usual causes are competitive keywords without the relevance to win them cheaply, targeting that’s pulling in clicks from people who were never going to buy, or conversions that just aren’t worth enough to justify the cost.
What to do:
- Shift toward long-tail, high-intent keywords. They cost less and convert better.
- Add negative keywords aggressively. Block the irrelevant searches eating budget.
- Segment ROAS by campaign, audience and product. Pull spend away from the segments dragging the average down.
- Reassess the offer. If the margin is too thin, no amount of campaign optimisation will fix it. Bundling, upselling or pricing changes might.
Low CPA, High Conversion Rate
The campaign is working. The question becomes how to scale it without breaking it.
What to do:
- Scale gradually. Bump the budget and watch CPA. Efficiency often slips as volume increases.
- Replicate the winning formats. Use the same ad and landing page structures in new campaigns or for other products.
- Build lookalike audiences from existing converters.
- Keep testing. Ad fatigue is real, and what’s winning today rarely wins forever.
Why Does PPC Performance Vary So Much Between Campaigns?
Performance varies because PPC isn’t really one thing. It’s a stack of decisions about platform, targeting, creative, bidding, landing page and offer, and small changes in any of those compound.
A campaign on Google Search targeting a high-intent keyword performs nothing like a campaign on Meta targeting a cold audience. Search ads work because people are actively looking. Social ads work because they interrupt people who weren’t. The metrics that matter, the costs you should expect, and the optimisations that move the needle are all different.
Within a single platform, the same patterns repeat. Mobile users behave differently to desktop. Weekend traffic converts differently to weekday traffic. A returning visitor is a different animal to a first-time click.
The implication is that you can’t optimise a campaign as a single block. Segment first, then optimise the segments separately. That’s where most of the real gains come from.
Secondary Metrics Worth Tracking
The five core metrics carry most of the weight. These three round out the picture.
Impression share is the percentage of times your ad was shown compared to how often it could have been shown. A low impression share means budget or ad rank is holding you back. It’s the quickest way to spot whether you’re capped by spend or by relevance.
View-through conversions capture the people who saw your ad, didn’t click, then converted later through another channel. Display and remarketing campaigns rarely show their full value without this metric.
Device performance shows how your ads convert across mobile, desktop and tablet. Mobile traffic often clicks more but converts less, which can be a strong signal that the mobile experience needs work.
How to Optimise a PPC Campaign
Evaluating is the first half. The second is doing something about what you found. Four practices separate campaigns that improve from campaigns that just keep running.
Segment the Data
Overall numbers hide what’s actually happening. The campaign average might look fine while one device, one location or one audience is quietly dragging it down.
Segment by:
- Device. Compare mobile, desktop and tablet performance side by side
- Location. Look for regions where conversion rates are higher or CPCs are lower
- Audience. Break down by demographic, interest or behaviour
- Time. Day of week and time of day often reveal patterns worth acting on
The goal isn’t to look at every cut of the data. It’s to find the segments where small changes will move the overall numbers the most.
Compare Against Benchmarks
External benchmarks tell you whether your performance is typical for your industry. Internal benchmarks (your own historical data) tell you whether you’re improving over time. You need both.
Use external numbers to set realistic targets. Use your own data to measure whether the changes you’re making are actually working.
Test and Learn
A/B testing is how PPC campaigns improve. The discipline matters more than the volume of tests.
- Change one variable at a time. Headline, image, CTA, landing page layout. Not all four at once.
- Run tests long enough to gather meaningful data. A few hundred clicks at minimum.
- Use the built-in tools. Google Ads Experiments and Meta’s A/B testing features are free and handle the maths for you.
- Document what wins, what loses, and what surprises you. The patterns are valuable.
Track Over Time
PPC performance fluctuates. A bad day or a quiet week doesn’t mean the campaign is broken, and one good week doesn’t mean it’s fixed.
Use rolling averages to smooth out noise. Compare week-over-week and month-over-month. Annotate the dashboard when you make changes so you can tell what caused a shift later. And resist the urge to react to short-term dips before you know whether they’re signal or noise.
Where to Go From Here
Most of the gains in a PPC campaign come from a small number of changes done well. Get the metrics right. Read them together rather than in isolation. Benchmark against your industry and your own history. Test methodically. Track over time. That’s most of the work.
What it isn’t is a one-off exercise. PPC is a system that compounds with attention. The accounts that improve are the ones that get reviewed properly, week after week, with someone asking the right questions of the data.
If your campaigns aren’t performing the way they should, the answer is almost always in the data. The question is whether anyone’s reading it. Our team works with businesses to turn paid advertising spend into real return, and that starts with knowing exactly what your numbers are telling you. Have a look at our paid advertising services, check out our broader approach to digital marketing and SEO, or read our piece on how to set up your Google Analytics dashboard if you want to make sure you’re tracking the right things in the first place.